Electrify Chicago
According to the
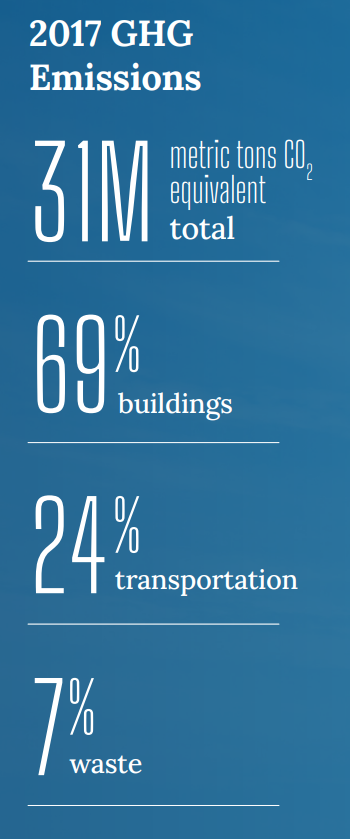
2022 Chicago Climate Action Plan ,
a whopping 69% of Chicago's emissions come from buildings, making it
our biggest challenge and our biggest opportunity as a city to tackle
change. At Electrify Chicago we want to showcase some of the best and worst performing
buildings in the city using publicly available data and manual annotations to add
building photographs and label multi-building owners like universities.
,
a whopping 69% of Chicago's emissions come from buildings, making it
our biggest challenge and our biggest opportunity as a city to tackle
change. At Electrify Chicago we want to showcase some of the best and worst performing
buildings in the city using publicly available data and manual annotations to add
building photographs and label multi-building owners like universities.
You can start by looking at Chicago's buildings with the highest greenhouse gas intensity - this means that they use the most energy when adjusted per unit of square foot, so big buildings could actually perform much better than very inefficient small buildings on this metric.
Chicago Buildings by Greenhouse Gas Intensity
Note: Data only includes large Chicago buildings from 2020
Note: This data only includes buildings whose emissions are reported
under the
Chicago Energy Benchmarking Ordinance. According to the City “As of 2016,
this list includes all commercial, institutional, and residential buildings larger than
50,000 square feet.” This dataset is also then filtered to only buildings with
reported emissions > 1,000 metric tons CO2 equivalent.
This data is also from 2020, but when new benchmark data is available, we'll update the site.
| Property Name / address | Primary Property Type |
Greenhouse Gas Intensity (kg CO2 eq./sqft) |
Total Greenhouse Emissions (metric tons CO2 eq.) |
|---|---|---|---|
|
2700-2714 N Spaulding Ave
2700 2714 N SPAULDING AVE
| Multifamily Housing | 8.7 kg/sqft
Highest 21%
| 433 tons
Lowest 21%
|
|
John W Garvy Elementary School
5225 N Oak Park Ave
| K-12 School | 8.6 kg/sqft
Highest 22%
| 686 tons
Lowest 40%
|
|
Joshua D Kershaw Elementary School
6450 S Lowe Ave
| K-12 School | 8.6 kg/sqft
Highest 22%
| 449 tons
Lowest 22%
|
|
Misericordia Home
6300 N Ridge Ave
| Mixed Use Property | 8.6 kg/sqft
Highest 22%
| 6,200 tons
Highest 5%
|
|
Roseland Centre 10450 S Michigan
10450 S Michigan Ave
| Senior Living Community | 8.6 kg/sqft
Highest 22%
| 664 tons
Lowest 39%
|
|
525 S. Dearborn St.
521 531 S DEARBORN ST
| Multifamily Housing | 8.6 kg/sqft
Highest 22%
| 485 tons
Lowest 26%
|
|
2555 North Clark
2555 N Clark St
| Multifamily Housing | 8.6 kg/sqft
Highest 22%
| 1,300 tons
Highest 36%
|
|
George H Corliss High School
821 E 103rd St
| K-12 School | 8.6 kg/sqft
Highest 22%
| 2,347 tons
Highest 18%
|
|
The Boyce Building
500 - 510 N Dearborn St
| Office | 8.6 kg/sqft
Highest 22%
| 1,287 tons
Highest 36%
|
|
Aunt Martha's Youth Service Center, Inc.
5001 - 5013 S Michigan Ave
| Other - Services | 8.6 kg/sqft
Highest 22%
| 520 tons
Lowest 28%
|
|
1980 - KIMBALL & ADDISON
3500 N Kimball Ave
| Retail Store | 8.6 kg/sqft
Highest 22%
| 946 tons
Highest 47%
|
|
Alpha Tower Apartments
936 E 47TH ST
| Multifamily Housing | 8.6 kg/sqft
Highest 22%
| 1,183 tons
Highest 39%
|
|
55 East Monroe Office
🚩
55 E Monroe St
| Office | 8.6 kg/sqft
Highest 22%
| 14,344 tons #36 Highest
|
|
Coeval - CO (cv013)
51 E 14TH ST
| Multifamily Housing | 8.5 kg/sqft
Highest 23%
| 1,579 tons
Highest 30%
|
|
John C Burroughs Elementary School
3542 S Washtenaw Avenue
| K-12 School | 8.5 kg/sqft
Highest 23%
| 455 tons
Lowest 23%
|
Data Source:
Chicago Energy Benchmarking Data