Electrify Chicago
According to the
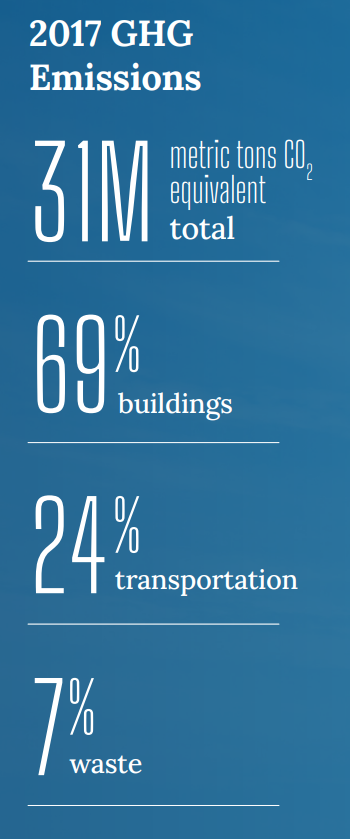
2022 Chicago Climate Action Plan ,
a whopping 69% of Chicago's emissions come from buildings, making it
our biggest challenge and our biggest opportunity as a city to tackle
change. At Electrify Chicago we want to showcase some of the best and worst performing
buildings in the city using publicly available data and manual annotations to add
building photographs and label multi-building owners like universities.
,
a whopping 69% of Chicago's emissions come from buildings, making it
our biggest challenge and our biggest opportunity as a city to tackle
change. At Electrify Chicago we want to showcase some of the best and worst performing
buildings in the city using publicly available data and manual annotations to add
building photographs and label multi-building owners like universities.
You can start by looking at Chicago's buildings with the highest greenhouse gas intensity - this means that they use the most energy when adjusted per unit of square foot, so big buildings could actually perform much better than very inefficient small buildings on this metric.
Chicago Buildings by Greenhouse Gas Intensity
Note: Data only includes large Chicago buildings from 2020
Note: This data only includes buildings whose emissions are reported
under the
Chicago Energy Benchmarking Ordinance. According to the City “As of 2016,
this list includes all commercial, institutional, and residential buildings larger than
50,000 square feet.” This dataset is also then filtered to only buildings with
reported emissions > 1,000 metric tons CO2 equivalent.
This data is also from 2020, but when new benchmark data is available, we'll update the site.
| Property Name / address | Primary Property Type |
Greenhouse Gas Intensity (kg CO2 eq./sqft) |
Total Greenhouse Emissions (metric tons CO2 eq.) |
|---|---|---|---|
|
Lakeside Tower Condo Association
1600 S Indiana Ave
| Multifamily Housing | 5.9 kg/sqft
Lowest 39%
| 1,446 tons
Highest 32%
|
|
1000 Adams CA
1000 W Adams St
| Multifamily Housing | 5.9 kg/sqft
Lowest 39%
| 1,090 tons
Highest 42%
|
|
HRTL - Leland Apts: 1207 W Leland Ave
1201 1213 W LELAND AVE
| Multifamily Housing | 5.9 kg/sqft
Lowest 39%
| 440 tons
Lowest 21%
|
|
Tower Lofts Condo
3240 N ASHLAND AVE
| Multifamily Housing | 5.9 kg/sqft
Lowest 39%
| 1,041 tons
Highest 44%
|
|
Hazel Apartments, LLC
4278 N HAZEL ST
| Multifamily Housing | 5.9 kg/sqft
Lowest 39%
| 280 tons
Lowest 8%
|
|
Lewis Towers-ID# 174182
820 N Michigan Ave
| Office | 5.9 kg/sqft
Lowest 39%
| 1,285 tons
Highest 36%
|
|
Clark Street Investors L.L.C.
3134 N Clark St
| Urgent Care/Clinic/Other Outpatient | 5.9 kg/sqft
Lowest 39%
| 342 tons
Lowest 13%
|
|
Apostolic Church of God
6340 S Dorchester Ave
| Worship Facility | 5.9 kg/sqft
Lowest 39%
| 1,284 tons
Highest 37%
|
|
55 W. Chestnut Apartments
55 W CHESTNUT ST
| Multifamily Housing | 5.9 kg/sqft
Lowest 39%
| 1,215 tons
Highest 38%
|
|
624 S Michigan
624 S Michigan Ave
| College/University | 5.9 kg/sqft
Lowest 39%
| 953 tons
Highest 47%
|
|
Santa Clara Hall-ID# 161053
1000 - 1008 W Loyola Ave
| Residence Hall/Dormitory | 5.9 kg/sqft
Lowest 39%
| 359 tons
Lowest 14%
|
|
2101 S. Michigan Apartments
2101 S Michigan Ave
| Multifamily Housing | 5.9 kg/sqft
Lowest 39%
| 1,199 tons
Highest 39%
|
|
North Park Village Apartments
5801 N Pulaski Rd - Bldg H
| Residential Care Facility | 5.9 kg/sqft
Lowest 39%
| 1,621 tons
Highest 29%
|
|
Hilliard Homes Limited Partnership (Senior)
2111 S Clark Ave
| Multifamily Housing | 5.9 kg/sqft
Lowest 39%
| 1,518 tons
Highest 31%
|
|
224 North Desplaines
224 N Desplaines St
| Office | 5.9 kg/sqft
Lowest 39%
| 457 tons
Lowest 23%
|
Data Source:
Chicago Energy Benchmarking Data